
-
Market conditions under coronavirus pandemic
The Warsaw exchange followed global trends in 2020. After a difficult and uncertain Q2, GPW welcomed a series of successful IPOs of e-commerce, biotech and gaming companies
Implications for GPW:
In 2020, GPW consolidated its position of the regional hub for gaming companies. However, the highlight of the year was the historically biggest IPO of Allegro worth PLN 10.6 billion (including the exercised option of additional allotment of 15% of shares). Many new individual investors joined the market in 2020: KDPW operated over 1.329 million securities accounts and omnibus accounts at the end of 2020. Nearly 85 thousand new brokerage accounts were opened in 2020 (+6.8%), the biggest growth since 2010 when investor interest was sparked by large privatisation projects (including GPW, Tauron, PZU).
Number of securities accounts and omnibus accounts maintained by KDPW and change month to month

Source: KDPW
In 2020, due to the global COVID-19 pandemic, in particular cases reported in Poland, the Exchange Management Board continuously monitored the impact of that risk on the functioning of the Exchange and the entire capital market ecosystem. The global capital markets were under strong pressures caused by the contagion in 2020. Under such demanding conditions, it was a priority of the Exchange to ensure safe trading and use best efforts to maintain the business continuity and availability of services provided by the Exchange.
- Globalisation and competition:
Competition of financial instrument trading venues in Europe has increased over the past few years following the implementation of EU Directives MiFID I and MiFID II. Operators of regulated markets compete for new issuers, investors, liquidity and trade. Another challenge for exchanges is posed by OTC (Over The Counter) markets, MTFs (Multilateral Trading Facilities) and SIs (Systematic Internalisers), supported by MiFID I and MiFID II.
Some MTFs have been licensed as regulated markets, for instance CBOE Europe Equities. The experience of other exchanges suggests that the emergence of alternative trading venues boosts the total turnover in stocks on the market due to the emergence of new investor categories as well as arbitrage strategies pursued by market participants who trade in the same stocks on two or more venues. However, the percentage share of incumbent exchanges in total trading typically shrinks. Trading in Polish equities has been offered for several years among others by the London-based venue Turquoise (owned by the London Stock Exchange) and, since 5 November 2018, by CBOE Europe Equities. Polish stocks were traded on certain trading days on both of these venues in 2020 but their share in total trade was negligible. In the opinion of GPW, this could suggest that smaller markets, such as GPW, tend to concentrate trading. Alternative trading venues which offer trade in Polish stocks charge significantly lower execution fees but their costs of clearing and settlement are much less competitive.
Implications for GPW:
Actions taken to continuously develop and increase the competitiveness of the GPW:
- improvement of stock market liquidity and order book quality. GPW has offered promotions to electronic traders (HVP, HVF) as well as programmes for market makers. GPW has added and improved system functionalities which address the needs of those market participants who trade in large volumes.
- development of colocation services launched in Q1 2016, a key part of the capital market infrastructure which supports the development of electronic liquidity providers and largely improves liquidity of the order book.
- the Technology Development Support Programme launched in 2019 continued in 2020. Developed in consultation with brokers, the Programme offers discounts on some exchange fees to those brokers who invest in additional technological potential and improve the quality of service.
- on 2 July 2020, the Exchange Management Board approved new companies to join the Analytical Coverage Support Programme which opened in June 2019. As a result, 12 companies joined the group of 39 Programme participants. The Programme covers 51 companies (for details see section 4.3.8).
- trading on GPW platforms becomes more attractive with the Employee Capital Plans (PPK) programme and planned initiatives under the Capital Market Development Strategy (SRRK).
- following the promotion of Poland to Developed Markets by FTSE Russell and Stoxx, GPW actively promotes the Polish stock market among global investors. In 2020, when conferences could not be held in the traditional format, the Exchange offered the first virtual roadshow for global investors.
- growing activity of individual investors – their growing presence on GPW helps to boost the value of turnover, improve the velocity ratio, and consolidate the position of GPW as a regional financial hub. GPW offers a range of educational initiatives and conferences addressed to individual investors.
- primary market development – Warsaw’s IPO market picked up strongly in 2020 and the 2021 IPO pipeline looks very promising.
Equity trading on European FESE exchanges and alternative trading venues [EUR bn]

Source: FESE – European Equity Market Report; *CBOE Europe Equities is a regulated market according to FESE classification. For comparison, it is shown under MTFs
According to FESE data, MTFs (Turquoise, Aquis Exchange) and CBOE Europe Equities (originally an MTF, now classified as a regulated market by FESE; for the purposes of this analysis, it is considered an MTF) generated EUR 2.2 trillion i.e. 20.9% of European stock trade on the electronic order book in 2020. The total value of European stock trade on the electronic order book (exchanges and MTFs) stood at EUR 10.8 trillion in 2020.
-
Number of listed companies
All European exchanges – members of FESE and WFE listed 9,326 domestic companies at the end of 2020. The Spanish exchange BME had the biggest number of listings (2,711 companies), followed by LSE (1,969 companies). GPW ranked fifth with 782 domestic companies.
Number of domestic companies listed on European exchanges at 2020 YE

Source: FESE; WFE
Implications for GPW:
There were 7 new listings on the GPW Main Market and 14 new listings on the NewConnect alternative market in 2020. The value of Initial Public Offerings (IPOs) on European exchanges in 2020 stood at EUR 20.3 billion, a decrease of 8% year on year (EUR 22.1 billion in 2019). According to PwC’s IPO Watch Europe 2020 report, Allegro.eu was the second biggest IPO in Europe (and the tenth biggest IPO globally) in 2020.
- Capitalisation of stock markets
According to FESE, Europe’s biggest exchanges as measured by capitalisation as at the end of 2020 included the Euronext Group (which operates regulated markets in Belgium, France, Ireland, the Netherlands, Portugal, Norway and the UK), LSE and Deutsche Boerse.
Capitalisation of domestic companies on European exchanges at 2020 YE [EUR billion]

Source: FESE, (monthly statistics, December 2020); LSE Group data based on WFE statistics and converted from USD to EUR
Implications for GPW:
GPW ranked seventh (PLN 146 billion) in Europe and was CEE’s biggest market.
-
Equity trade
According to FESE’s report, the European exchange industry is dominated by several large operators as measured by the value of equity trade. The European leader in 2020 was the Euronext Group (EUR 2.19 trillion) followed by the London Stock Exchange Group (EUR 1.84 trillion) and Deutsche Boerse (EUR 1.81 trillion).
Value of trade in shares on the electronic order book on European exchanges in 2020 [EUR billion]

Source: FESE (monthly statistics, December 2020)
Percentage change in the value of trade in shares on the electronic order book on European exchanges in 2020 vs. 2019 [EUR]

Source: FESE (monthly statistics, December 2020)
Implications for GPW:
According to FESE statistics, the value of trade in stocks on the electronic order book on GPW was EUR 70.1 billion in 2020 (+56.1% YoY), equal to a share of approximately 0.70% in the European market vs. 0.48% in 2019. GPW remained the CEE leader by the value of trade in shares in 2020.
-
Velocity ratio
The velocity ratio measures turnover in relation to average monthly capitalisation on an exchange. FESE statistics present velocity by month. On average in 2020, domestic equity trading velocity was the highest on the Deutsche Boerse (87.8%) and SIX (69.8%).
Velocity on European exchanges in 2020

Source: FESE and WFE for LSEG
Implications for GPW:
GPW’s average velocity was 59.8% in 2020, one of the highest in Europe.
-
Electricity and gas market
The growth in electricity trade was mainly driven by developments on the forward market, which operates as the Electricity Forwards Market since the launch of the Organised Trading Facility in early May 2020. The share of the forward market in total electricity trade once again exceeded 85% (85.7%) and the nominal volume of trade was 208.3 TWh in 2020, an increase of 5.0% over the record-high 2018 and an increase of 6.8% year on year. The year-on-year increase of turnover on the forward market was at a high 40% until the end of June. The high turnover in that period was driven by major changes in power consumption during the pandemic, resulting in major changes of prices of both greenhouse gas emission allowances and electricity. For a large part of H2, from August to November, turnover decreased year on year, among others due to the announced liquidation of the obligation of electricity producers to sell electricity on the commodity exchange, through a NEMO or on a market operated by a regulated market operator. On 26 January 2021, the Ministry of Climate and Environment published draft legal amendments and opened a public consultation.
The spot electricity market also broke new records in 2020, driven by the development of the Intra-Day Market which is a part of the European Single Intra-Day Coupling system since November 2019. As a result, turnover on the Intra-Day Market more than doubled year on year in 2019 and increased by a factor of 12 year on year to more than 2 TWh in 2020. The Day-Ahead Market reported a decrease of 3.0% to 32.7 TWh. The total turnover on the spot electricity market increased by 0.9 TWh i.e. 2.8%.
Electricity prices dropped in 2020 due to reduced electricity consumption in the early months of the pandemic and due to a warm winter. The latter factor combined with strong winds resulted in low prices on the spot electricity market early in the year before the pandemic: the average price on the Day-Ahead Market was 170.24 PLN/MWh in February 2020, the lowest since January 2018. Prices on the Day-Ahead Market bounced back to 220 PLN/MWh, close to the 2019 average, in June and rose late in the year to more than 250 PLN/MWh among others due to rising prices of emission allowances as electricity consumption in Q4 2020 was back at the Q4 2019 level. The spot gas market followed similar trends: prices in January were at summer levels (under 60 PLN/MWh). Prices for deliveries in later months, up to the end of the summer holiday period, hit historical lows. Monthly prices on the Day-Ahead and Intra-Day Market in gas reached a historical low of 27.95 PLN/MWh in June and bounced back to over 80 PLN/MWh by the year’s end.
Volume of trade in electricity and gas on European exchanges
Trade in electricity and gas on the exchange increased in 2020, reaching historical highs on both markets. The growth rate was the highest on the electricity market at 6.2% from 228.9 TWh to 243.2 TWh. The growth on the gas market was 3.4% from 146.1 TWh to 151.1 TWh.
Volume of trade in electricity on European exchanges in 2020 (day-ahead markets) [TWh]

Source: TGE based on exchange data
Volume of trade in electricity on European exchanges in 2020 (forward markets) [TWh]

Source: TGE based on exchange data
Volume of trade in gas in European hubs (spot markets) in 2020 [TWh]

Source: TGE based on exchange data
Volume of trade in gas in European hubs (forward markets) in 2020 [TWh]

Source: TGE based on exchange data
-
Property rights
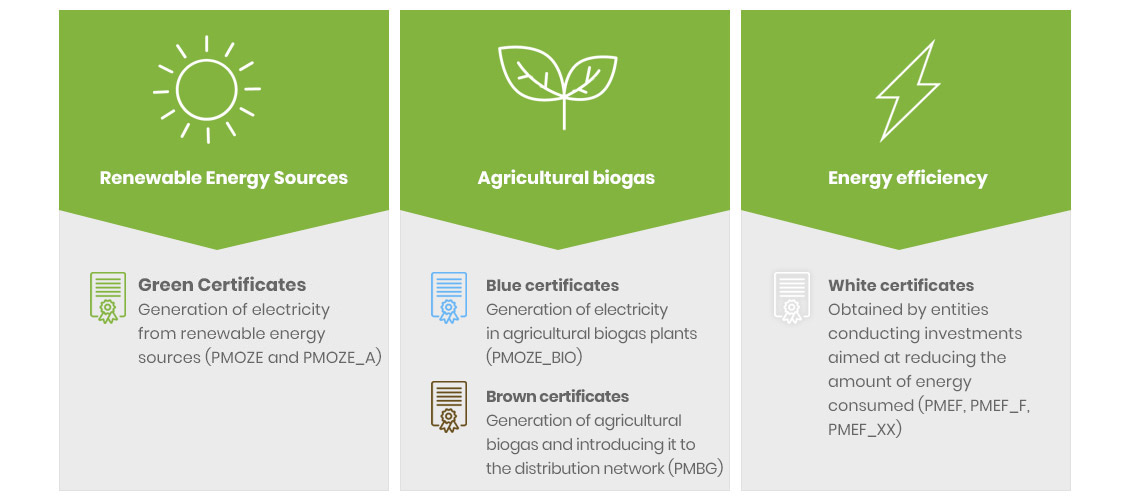
A new amendment of the Act on Renewable Energy Sources took effect in 2019, leading to a series of RES auctions which took place late in the 2020.
On 29 June 2019, the amendment to the Act entered into force, pursuant to which the validity of white certificates issued by the President of the Energy Regulatory Office was extended by two years (until 30 June 2021). This means that obliged entities will be able to fulfil the "efficiency" obligation with the PMEF instrument for the next two years, 2019 and 2020. The regulation has a positive effect on the trading and redemption of white certificates.
Implications for TGE:
Trade in green and blue certificates on the Property Rights Market reached approximately 27 TWh in 2020.
The volume of trade on the Property Rights Market is driven by the number of certificates issued in the Register of Certificates of Origin: increased production of energy generates the obligation to issue more certificates of origin, which in turn generates an increase of the volume of certificates of origin available on the market.
Trading in RES instruments (PMOZE, PMOZE_A and PMOZE-BIO) on the electronic order book reached 10.2 TWh in 2020 and non-EOB trade was 16.8 TWh. The total volume was close to 27.0 TWh in 2020, an increase of 4.0% year on year. The volume of issued RES property rights increased to 22.3 TWh and was the highest since 2017.
Trade in white certificates (PMEF, PMEF-2019, PMEF-2020, PMEF_F) decreased sharply in 2020. The total volume was 191.0 ktoe, a decrease of 61.2% year on year. EOB trade stood at 143.0 ktoe (down by 67.2%) and non-EOB trade was 48.0 ktoe (down by 15.1%). The main reason for the low turnover was the reduced supply of certificates due to a low volume of issued property rights (down by 46% year on year and 40% against 2018) as well as a high base of the record setting year 2019.